Team:NC School of Sci Math/Lab Notebook
From 2013hs.igem.org
(Difference between revisions)
| Line 1: | Line 1: | ||
| + | <html><head> | ||
| + | <style type="text/css"> | ||
| + | h3 | ||
| + | { font-color: #00008B; } | ||
| + | </style> | ||
| + | </head></html> | ||
| + | {{NotebookUpper}} | ||
{{NCSSM_iGEM_13| | {{NCSSM_iGEM_13| | ||
Content= | Content= | ||
__NOTOC__ | __NOTOC__ | ||
| - | |||
<!-- | <!-- | ||
| Line 15: | Line 21: | ||
/--> | /--> | ||
| - | + | ===Lab Notebook=== | |
| - | <html> | + | <html><h2><a name="Planning" style="color:#00008B;">Planning and Development</a></h2> |
| - | + | <h4><a style="color:#00008B; float:right;" name="01/11/2013">01/11/2013</a></h4></html> | |
| - | + | ||
| - | + | ||
| - | + | ||
| - | <h2><a name="Planning" style="color:#00008B;">Planning and Development</a></h2> | + | |
| - | <h4><a style="color:#00008B;" name="01/11/2013">01/11/2013</a></h4> | + | |
| - | </html> | + | |
<b>Brainstorming for project ideas </b> | <b>Brainstorming for project ideas </b> | ||
<br /> | <br /> | ||
| Line 129: | Line 130: | ||
<html> | <html> | ||
| - | <h4>03/25/2013</h4> | + | <h4><a style="color:#00008B;" name="03/25/2013">03/25/2013</a></h4> |
</html> | </html> | ||
<p><b>Everyone began editing the proposal on a Google Doc today</b></p> | <p><b>Everyone began editing the proposal on a Google Doc today</b></p> | ||
| Line 196: | Line 197: | ||
** Showing yellow light increases both red and green light | ** Showing yellow light increases both red and green light | ||
** Can identify which color is being shown from the data | ** Can identify which color is being shown from the data | ||
| - | |||
| - | |||
}} | }} | ||
Revision as of 13:49, 20 June 2013
2013
Home Team Project Details Lab Notebook Results Human Impact Biosafety Acknowledgments Official Team Profile
Lab Notebook
Planning and Development
01/11/2013
Brainstorming for project ideas
- LDL-cholesterol biosensor
- Ocean salinity regulator (especially for coral reefs)
- Water contaminant multibiosensor
More research should be done
- Find related projects that have been completed
- Obstacles?
- BioBricks?
- Presentations in 3-4 weeks
01/18/2013
Discussions of each project- LDL-cholesterol biosensor
- Could be used as a blood test
- Blood sugar monitor-like device
- Hard to measure any color change in blood
- Ocean salinity regulator (especially for coral reefs)
- Need a lot of bacteria
- Environmental concerns
- Bacteria can do well in coral reefs
- Water contaminant multibiosensor
- Several Biobrick promoters for common contaminants
- Usage in sewer tanks
- Many different colors of fluorescent proteins
- Could incorporate newer technology for better color-sensing
- Will look up data on promoter/FP expression
02/01/2013
Presentations
- All ideas sound promising
- Meet next week to decide which idea to pursue
02/08/2013
Decision on project- LDL-cholesterol idea won't work
- Costly and hard to detect FPs in blood
- Multibiosensor is appealing
- Many applications
- Expandable with many different FPs
- Could bring in new technology
- Ocean salinity regulator is difficult because of the ocean
- Environmental factors and unknown variables
Multibiosensor chosen
02/15/2013
A few members met with Mr. Jon Davis to discuss potential technology
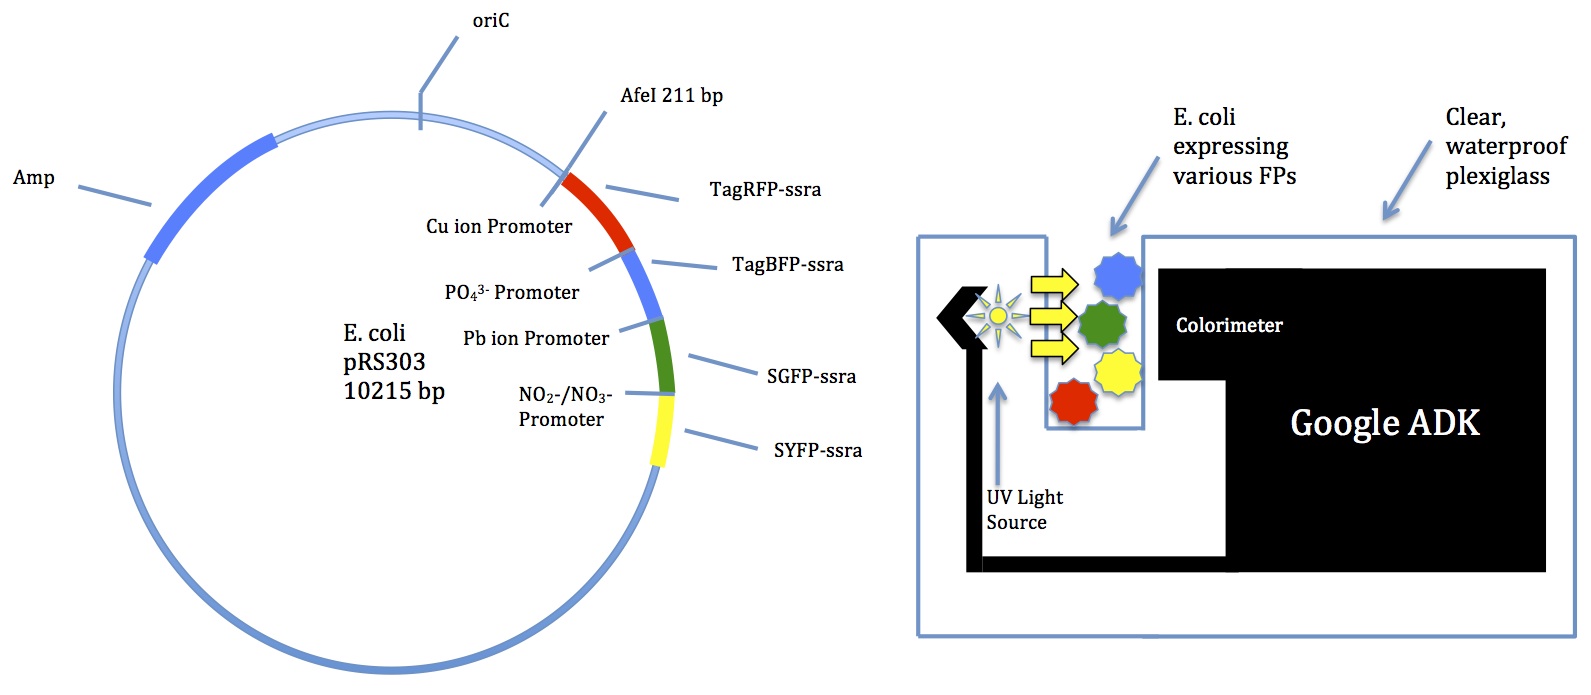
- Suggested a Google device called ADK
- Comes with a colorimeter
- Can be programmed for many functions
- School has a few we could try out
02/22/2013
Goals for the immediate future
- Find Biobricks
- Set up schedule for lab work
- Further research into possible uses
- Preliminary lab experiments
Project Proposal
03/01/2013
Discussion of upcoming project proposal:
- Introduction, Solution Statement, and Methods
- Need to find out some background information
- Should make use of Tinkercell modeling
03/04/2013
Assignments of roles for the upcoming project proposal:
- Madeline will investigate background information
- Danny will work on Tinkercell models
- Jack will write the solution statement and methods sections
- Synthesize our writing on a Google Doc
- Try to have individual parts done in about 2 weeks
03/18/2013
The following models have been created
- We should use these in the proposal, but continue to work on the Tinkercell model
03/25/2013
Everyone began editing the proposal on a Google Doc today
- Want to be finished by March 29th
- Tinkercells will probably not be ready in time
- Having a lot of trouble getting fluorescent protein levels to zero when they should be
- Danny will talk to Morgan to see if he can help
- Edit Edit Edit!
03/27/2013
- Proposal is coming along well
- Need to finish the methods, but otherwise complete
- Take pictures of the ADK and lab work
03/29/2013
- Proposal is done!
- Will submit soon
04/06/2013
Time to focus on creating the plasmid
- Finished Tinkercell model will help a bunch
- Do we want to think about ordering de novo from a gene synthesis company?
- Computer modeling is the best approach for now
04/17/2013
- Danny has a working Tinkercell model for the copper detector!
- Outputs increased levels of TagRFP as ion concentration increases
- We should be able to figure out the others soon
- The lead detector may be especially difficult because the ion binds to a promoter to create a transcription factor
Experimentation
04/27/2013
- We want to work with the ADK for the next couple of weeks
- Jack will attempt to code the ADK so it outputs to a text file
- Potential preliminary tests
- Diluted glow sticks
- Dimmed LED lights
- pGLO E. coli
05/04/2013
- The ADK has been coded
- We have glow sticks, E. coli expressing GFP, and dim LEDs to test
- Testing this Tuesday
05/07/2013
- Tested the sensing ability of the ADK today
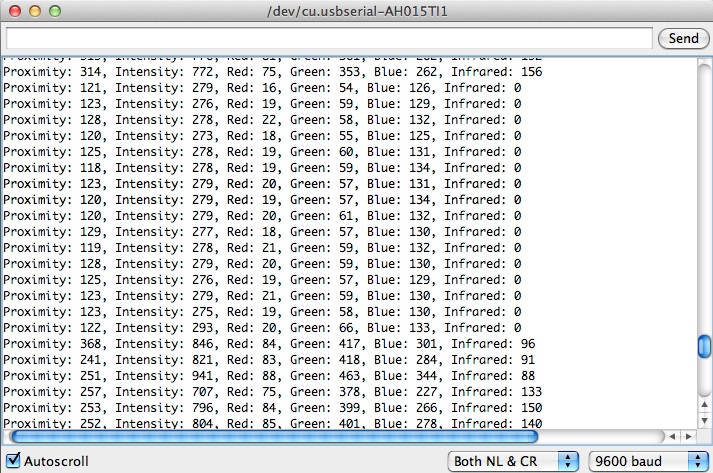
- Data is output in the form of the file below
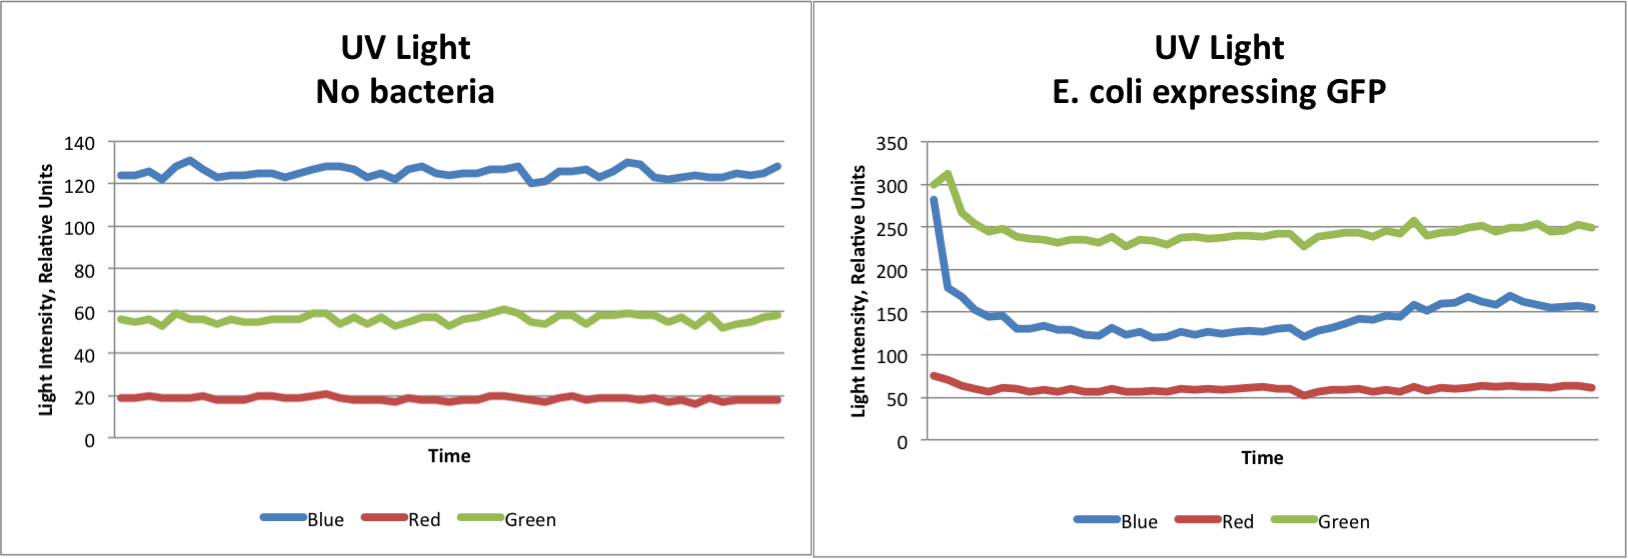
- The pGLO E. coli is the most closely related to our project and data is shown below
- Data from LED lights is very similar but allowed us to understand the sensing "logic" of the ADK
- Showing red, green, or blue light increases only the color being shown
- Showing yellow light increases both red and green light
- Can identify which color is being shown from the data
 "
"


