Team:NC School of Sci Math/Lab Notebook
From 2013hs.igem.org
Home Team Project Details Lab Notebook Results Human Impact Biosafety Acknowledgments Official Team Profile
Planning and Development
01/11/2013
Brainstorming for project ideas- LDL-cholesterol biosensor
- Ocean salinity regulator (especially for coral reefs)
- Water contaminant multibiosensor
More research should be done
- Find related projects that have been completed
- Obstacles?
- BioBricks?
- Presentations in 3-4 weeks
01/18/2013
Discussions of each project- LDL-cholesterol biosensor
- Could be used as a blood test
- Blood sugar monitor-like device
- Hard to measure any color change in blood
- Ocean salinity regulator (especially for coral reefs)
- Need a lot of bacteria
- Environmental concerns
- Bacteria can do well in coral reefs
- Water contaminant multibiosensor
- Several Biobrick promoters for common contaminants
- Usage in sewer tanks
- Many different colors of fluorescent proteins
- Could incorporate newer technology for better color-sensing
- Will look up data on promoter/FP expression
02/01/2013
Presentations
- All ideas sound promising
- Meet next week to decide which idea to pursue
02/08/2013
Decision on project- LDL-cholesterol idea won't work
- Costly and hard to detect FPs in blood
- Multibiosensor is appealing
- Many applications
- Expandable with many different FPs
- Could bring in new technology
- Ocean salinity regulator is difficult because of the ocean
- Environmental factors and unknown variables
Multibiosensor chosen
02/15/2013
A few members met with Mr. Jon Davis to discuss potential technology
- Suggested a Google device called ADK
- Comes with a colorimeter
- Can be programmed for many functions
- School has a few we could try out
02/22/2013
Goals for the immediate future
- Find Biobricks
- Set up schedule for lab work
- Further research into possible uses
- Preliminary lab experiments
Project Proposal
03/01/2013
Discussion of upcoming project proposal:
- Introduction, Solution Statement, and Methods
- Need to find out some background information
- Should make use of Tinkercell modeling
03/04/2013
Assignments of roles for the upcoming project proposal:
- Madeline will investigate background information
- Danny will work on Tinkercell models
- Jack will write the solution statement and methods sections
- Synthesize our writing on a Google Doc
- Try to have individual parts done in about 2 weeks
03/18/2013
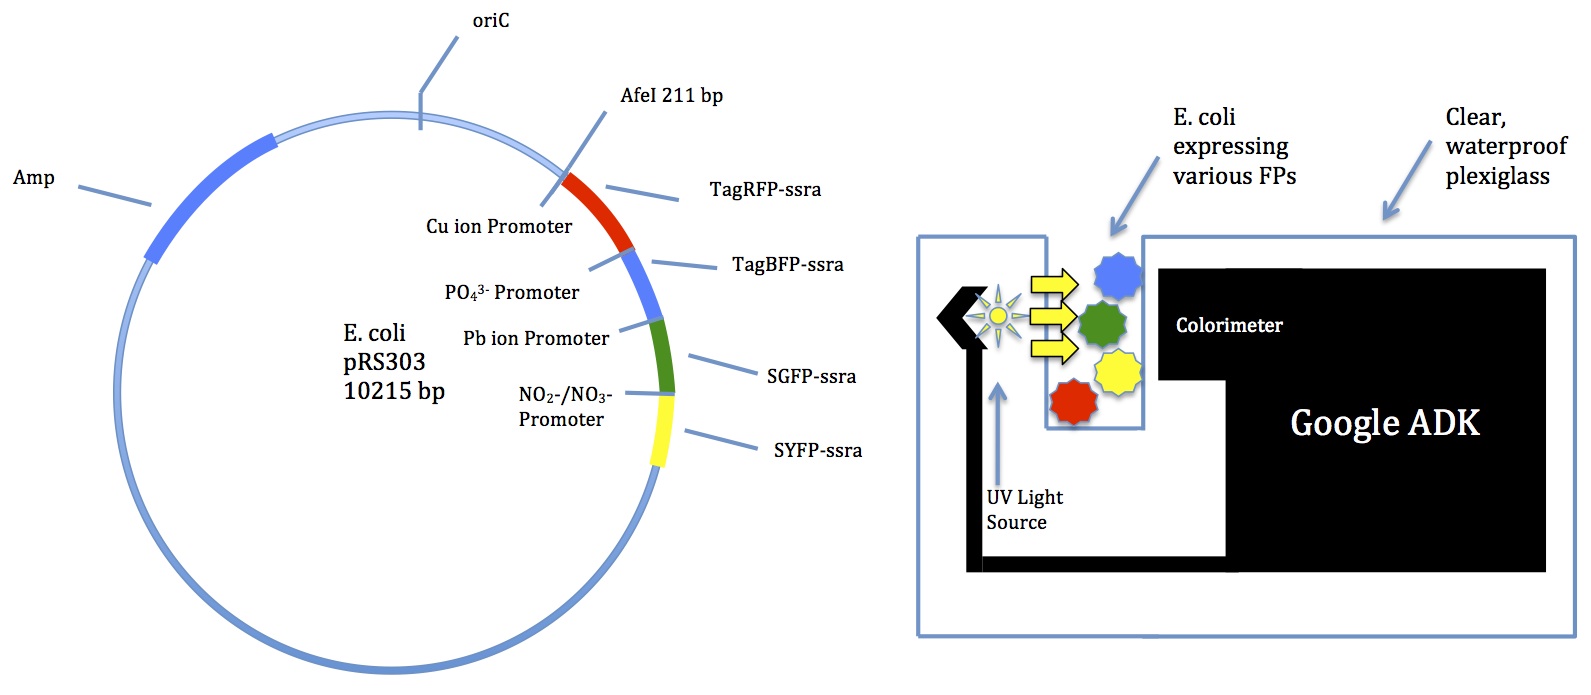
The following models have been created
- We should use these in the proposal, but continue to work on the Tinkercell model
03/25/2013
Everyone began editing the proposal on a Google Doc today
- Want to be finished by March 29th
- Tinkercells will probably not be ready in time
- Having a lot of trouble getting fluorescent protein levels to zero when they should be
- Danny will talk to Morgan to see if he can help
- Edit Edit Edit!
03/27/2013
- Proposal is coming along well
- Need to finish the methods, but otherwise complete
- Take pictures of the ADK and lab work
03/29/2013
- Proposal is done!
- Will submit soon
04/06/2013
Time to focus on creating the plasmid
- Finished Tinkercell model will help a bunch
- Do we want to think about ordering de novo from a gene synthesis company?
- Computer modeling is the best approach for now
04/17/2013
- Danny has a working Tinkercell model for the copper detector!
- Outputs increased levels of TagRFP as ion concentration increases
- We should be able to figure out the others soon
- The lead detector may be especially difficult because the ion binds to a promoter to create a transcription factor
Calibration and Characterization
04/27/2012
Template:NotebookLower
/b>
4 ml bacterial culture is pelleted by centrifugation at 10.000 rpm for 1 min. Afterwards, the pellet is resuspended in 250 µl buffer P1. 250 µl buffer P2 are added and the culture is gently inverted and incubated for 5 min. 350 µl buffer N3 are added and the suspension is centrifuged at 13.000 rpm for 10 min. The supernatant is subsequently loaded onto a miniprep column and centrifuged for 1 min/max speed. Afterwards the column is washed with buffer PB (500 µl) and buffer PE (750 µl) by loading onto the column and subsequent centrifugation for 1 min/max speed. After a last centrifugation step for drying the column (again 1 min/max speed), 50 µl of water are added in order to dissolve the DNA again. After 1 min incubation, DNA is eluted by centrifugation for 1 min/max speed.
Lab Notebook
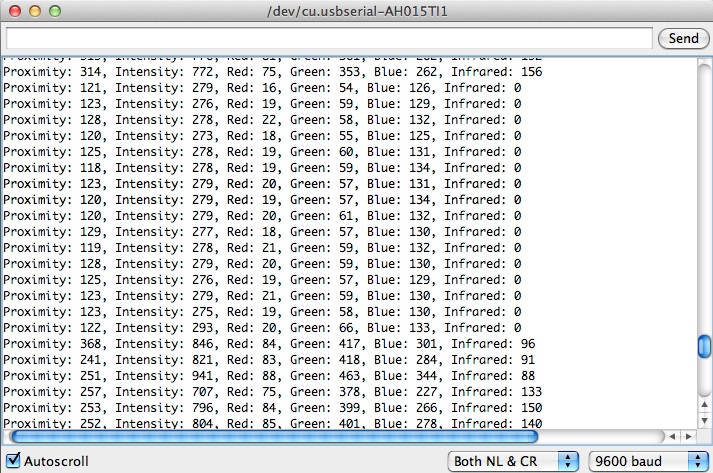
To begin our experiment, we needed to create a device that could detect color. We chose to use the Google ADK, an open ended platform that allows users to take control of many sensors that come attached to an Arduino board, including a colorimeter. However, a standard ADK is set up to match any color presented to it, using LED lights. In some of our preliminary tests, the reflection of the light from these LEDs skewed data. Therefore, we modified the code of the ADK, using Google's software developer package, so that it does not turn on its LED lights but instead outputs colorimeter data to a computer. An example of this output is shown below.
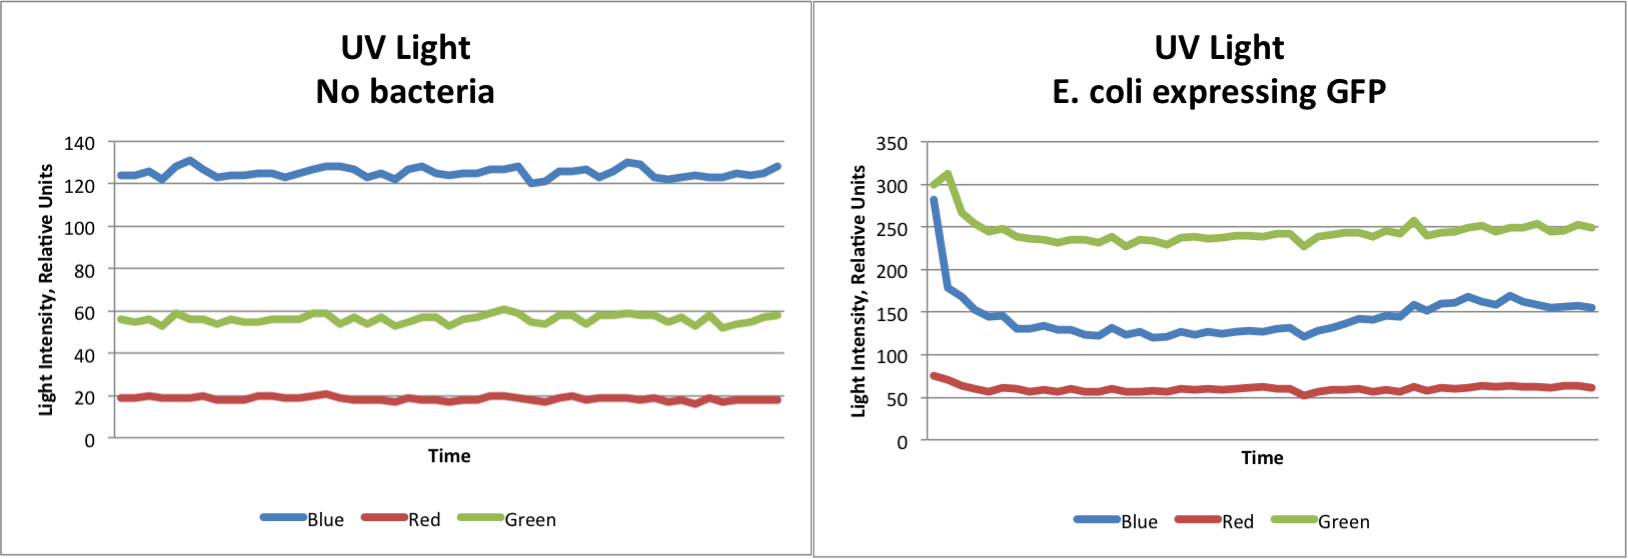
As a foray into our project, we first took some preliminary data using our modified Google ADK and pGLO E. coli expressing Green Fluorescent Protein. We found that we were able to detect a distinct change in color. Some baseline color was present from the UV Light source used for the experiment. The graphs below clearly show that our system is able to detect E. coli expressing GFP.
Small LED lights were used to test the ADK's ability to detect red, blue, and yellow lights. The results showed the same trends as the GFP test, indicating that we would be able to distinguish between several different colors expressed. In general, red, green, and blue lights show dramatic increases in the intensity of that color, while the other two colors remain about the same. Yellow light however, increase both red and green light, while blue remains at the same level. From these observations, we are able to identify which type of light is shown based only on the data collected.
 "
"
